
October 2026 CPI and Gold: Key Takeaways
- Headline CPI: Rose 0.4% month over month, compared with a 0.3% forecast.
- Core CPI: Increased 0.3%, above the 0.2% consensus forecast.
- Gold price: Fell 2.7% to $4,028.39 per ounce at 1:53 p.m. ET on November 10.
- Treasury yields: Two-year and ten-year yields increased as rate-hike expectations strengthened.
- Federal Reserve: Markets increased expectations for monetary tightening at the December meeting.
- Data limitation: Standard October 2026 annual headline and core CPI rates were unavailable because of missing October 2025 comparison data.
Publication date: November 11, 2026.
Data release: November 10, 2026, at 8:30 a.m. ET. Market figures reflect the dates and observation times reported by their sources.
October 2026 CPI Results: What Did the Inflation Report Show?
The US Bureau of Labor Statistics released the October 2026 Consumer Price Index report on Tuesday, November 10, at 8:30 a.m. Eastern Time.
According to the official Bureau of Labor Statistics CPI release, the Consumer Price Index for All Urban Consumers increased 0.4% on a seasonally adjusted monthly basis, following a 0.6% increase in September.
Although the monthly increase slowed from September, it remained above the 0.3% consensus estimate collected by Reuters. Meanwhile, core CPI rose 0.3%, exceeding the 0.2% forecast.
| Inflation Indicator | September 2026 | October 2026 |
|---|---|---|
| Headline CPI, monthly | +0.6% | +0.4% |
| Core CPI, monthly | +0.3% | +0.3% |
| Shelter | +0.4% | +0.3% |
| Food | 0.0% | +0.5% |
| Energy | +5.2% | +0.7% |
Source: US Bureau of Labor Statistics, October 2026 CPI release. Monthly percentage changes are seasonally adjusted.
Why the Difference Between Actual Inflation and Forecasts Matters
Financial markets respond not only to published economic figures but also to how those figures compare with prevailing expectations.
In October, headline inflation was lower than September’s reading, but higher than economists had anticipated. Core inflation also exceeded its consensus estimate.
This combination suggested that underlying price pressures remained persistent enough to influence expectations about future interest rates.
For gold investors, the policy implications of an inflation surprise can matter more in the short term than the direction of the monthly CPI figure alone.
What Drove US Inflation in October 2026?
The headline inflation reading reflects changes across many goods and services. Examining the underlying components helps explain whether price pressures are concentrated in a few categories or are more broadly distributed.
Shelter Costs Continued to Increase
The shelter index rose 0.3% in October, following a 0.4% increase in September. According to BLS, shelter accounted for more than 30% of the monthly increase in the overall CPI.
Housing-related expenses remain particularly important because shelter represents a substantial component of household spending and the consumer price index.
Although the monthly shelter increase moderated, its continued positive contribution showed that housing costs remained a source of inflationary pressure.
Food Prices Increased 0.5%
The food index advanced 0.5% in October after remaining unchanged in September.
Food at home increased 0.4%, while food away from home rose 0.5%. These movements affected both grocery purchases and restaurant spending.
Food prices can influence consumers’ perceptions of inflation because they represent frequent household expenses, even though food is excluded from the core CPI calculation.
Energy Inflation Slowed Significantly
The energy index increased 0.7% in October, considerably below September’s 5.2% increase.
Gasoline prices rose 1.0% on a seasonally adjusted basis, while electricity increased 0.9%. The utility gas service index declined 0.8%.
Energy’s slower monthly increase helped moderate headline inflation. However, positive changes in food, shelter, and other categories contributed to October’s above-consensus result.
Core Inflation Remained Persistent
Core CPI increased 0.3% for a third consecutive month. Categories contributing to the October increase included recreation, medical care, motor vehicle insurance, and other services.
At the same time, used cars and trucks declined 1.2%, illustrating that not every component moved higher.
The persistence of monthly core inflation was relevant to investors because underlying price pressures can influence expectations about the Federal Reserve’s response.

Why Were October 2026 Annual CPI Figures Unavailable?
One important limitation of the October 2026 CPI release was the absence of official year-over-year inflation changes for headline CPI, core CPI, and other series lacking the required comparison data.
BLS explained that a lapse in federal appropriations prevented the collection of survey data for October 2025. Because the corresponding comparison indexes were unavailable for most series, standard twelve-month changes could not be published for October 2026.
Important Data Clarification
The October 2026 figures of 0.4% headline CPI and 0.3% core CPI represent monthly, seasonally adjusted changes.
They should not be described as annual inflation rates. An estimated year-over-year figure should not be presented as an official BLS result.
This limitation does not invalidate the published monthly figures, but it reduces the scope of direct year-over-year comparisons with October 2025.
Investors should therefore rely on the officially available monthly data and avoid assuming that a missing annual figure implies a particular direction for inflation.
How Did Gold Prices React to the October 2026 CPI Report?
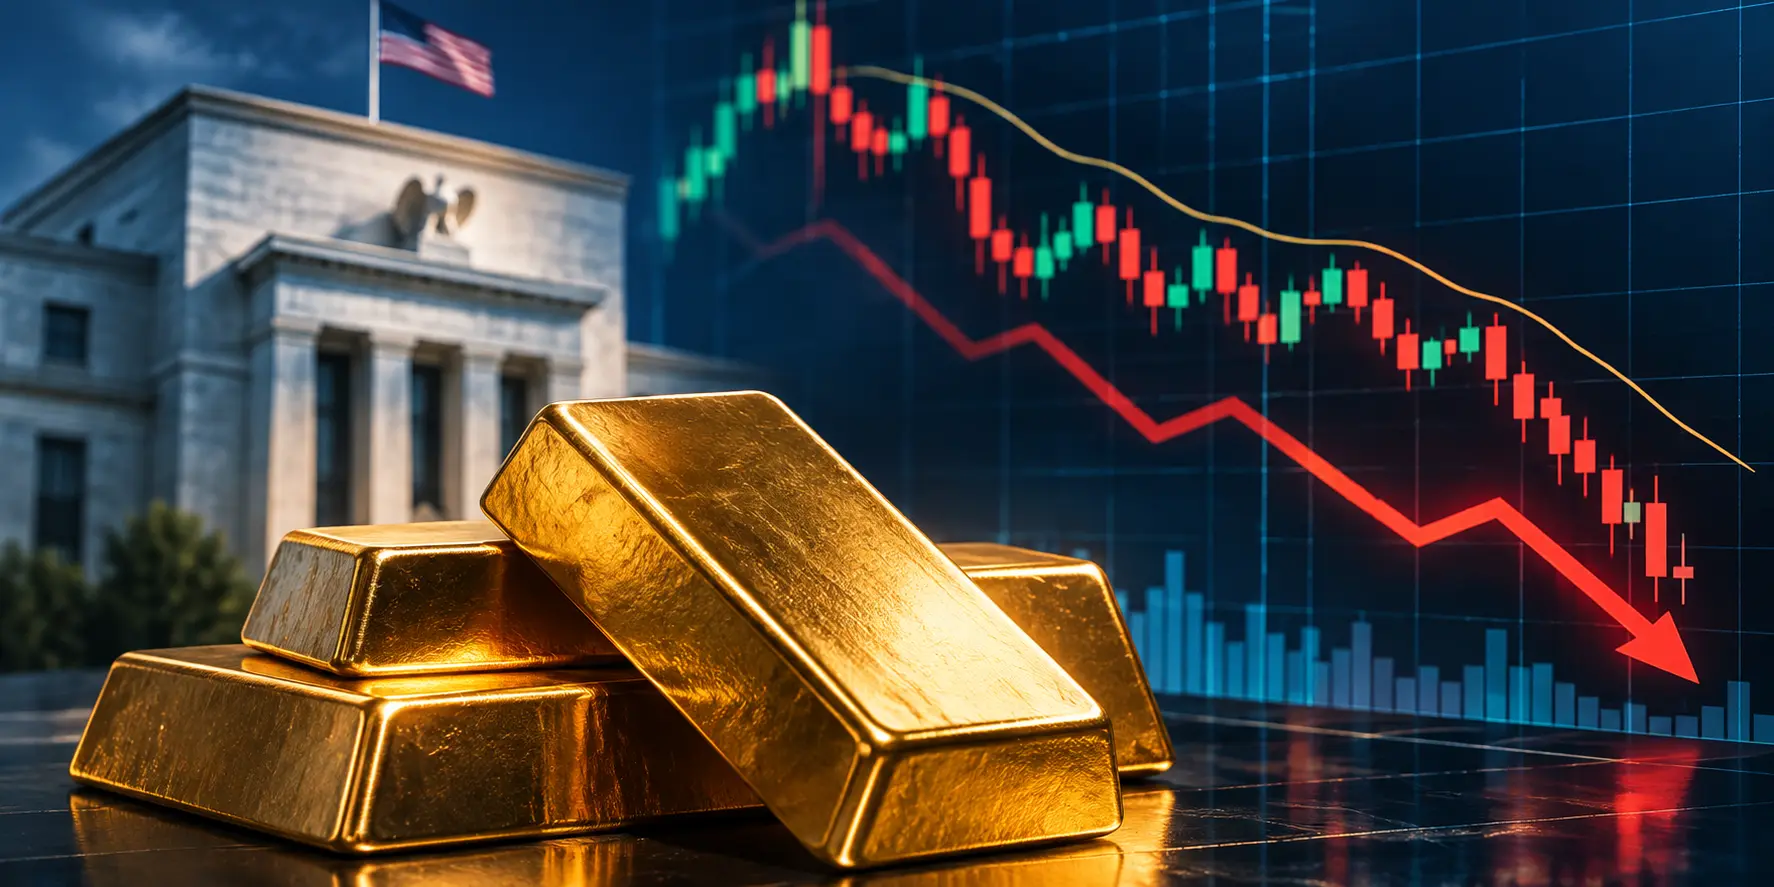
Gold prices declined sharply on November 10 after the stronger-than-expected inflation report contributed to rising Treasury yields and a firmer US dollar.
According to Reuters’ November 10 gold market report, spot gold fell 2.7% to $4,028.39 per troy ounce at 1:53 p.m. Eastern Time.
December US gold futures settled 2.0% lower at $4,030.20 per ounce.
The decline demonstrated that gold’s short-term response to inflation can differ from its perceived role as a long-term store of value.
Gold Market Reaction — November 10, 2026
| Market Indicator | Reported Value |
|---|---|
| Spot Gold | $4,028.39/oz, down 2.7% |
| Spot Price Observation | November 10, 1:53 p.m. ET |
| December Gold Futures | $4,030.20/oz, down 2.0% at settlement |
Source: Reuters, November 10, 2026. Spot gold and futures prices are different market instruments and were not necessarily observed at the same moment.
Why Did Higher Inflation Put Pressure on Gold?
Gold does not pay interest or dividends. When higher-than-expected inflation increases the likelihood of higher policy rates, interest-bearing assets can become more attractive relative to holding physical gold.
Rising Treasury yields may increase the opportunity cost of holding bullion. At the same time, a stronger dollar can make dollar-denominated gold more expensive for buyers using other currencies.
These relationships contributed to the market narrative following the November 10 CPI release. However, they should not be interpreted as mechanical rules that determine gold’s price in every market environment.
Did Gold Recover After the Initial Selloff?
The decline on November 10 did not mean gold continued falling without interruption.
In a Reuters market update published November 11, spot gold was reported 0.6% higher at $4,057.33 per ounce at 06:37 GMT.
The partial recovery followed the previous session’s sharp decline. Nevertheless, stronger inflation data and expectations of additional Federal Reserve tightening remained important considerations for traders.
This distinction matters because a price snapshot from one session should not be presented as a permanent change in the direction of the gold market.
US Dollar and Treasury Yields: What Happened After CPI?
The reaction in the bond and currency markets helped explain why gold faced selling pressure after the inflation announcement.
According to Reuters’ November 10 global markets coverage, US Treasury yields moved sharply higher as investors increased expectations for tighter monetary policy.
| Market Indicator | Reported Level | Reported Change |
|---|---|---|
| 2-Year Treasury Yield | 4.731% | +18.44 basis points |
| 10-Year Treasury Yield | 4.988% | +12.55 basis points |
| US Dollar Index | 102.25 | +0.56% |
The two-year Treasury yield is particularly sensitive to expectations about near-term Federal Reserve policy.
The ten-year yield reflects a broader combination of expected interest rates, inflation, economic growth, and risk premiums.
The US Dollar Index also strengthened, consistent with increased expectations for tighter monetary conditions.
Why Observation Times Matter
The gold price, dollar index, and Treasury yields quoted in market reports may represent different moments during the trading session.
For example, the spot gold quotation at 1:53 p.m. ET should not be treated as a synchronized observation with a Treasury yield recorded later in the day.
These values demonstrate the broader reported market reaction, not a precise second-by-second causal relationship.
What Does October CPI Mean for the Federal Reserve?
The hotter-than-expected CPI report increased market expectations that the Federal Reserve could raise interest rates at its December 8–9, 2026 meeting.
Reuters reported that financial markets had fully priced in a 25-basis-point increase after the data, while the estimated probability of a 50-basis-point move rose to approximately 10% from zero before the report.
These probabilities reflected market pricing at the time, not a decision already made by the Federal Reserve.
The possibility of a larger increase also attracted attention following comments from Federal Reserve Governor Christopher Waller about considering stronger action if inflation remained elevated.
However, monetary-policy decisions depend on a broad range of economic evidence, including employment, inflation, growth, and financial conditions.
The Federal Reserve Targets PCE Inflation, Not CPI
Although the October CPI report was important, the Federal Reserve’s longer-run inflation target of 2% is measured using the Personal Consumption Expenditures (PCE) price index.
As explained in the Federal Reserve’s official guidance on PCE inflation, CPI and PCE use different methodologies and expenditure weights.
CPI provides timely information about consumer prices, but the Federal Reserve considers multiple inflation indicators when assessing monetary policy.
Why Real Yields Matter for Gold
Inflation-adjusted interest rates, commonly known as real yields, are particularly relevant when evaluating the opportunity cost of holding gold.
Higher real yields can increase the relative appeal of interest-bearing assets. However, a rise in nominal Treasury yields does not necessarily mean real yields increased by the same amount.
A more complete analysis considers expected inflation alongside nominal yields rather than assuming that the two measures are interchangeable.
What Does the October CPI Report Mean for Gold Investors?
The November 10 market response showed that short-term gold prices can react negatively to unexpectedly high inflation when the immediate implication is tighter monetary policy.
However, a single CPI release does not establish the direction of gold prices over the coming months or years.
Longer-term market performance depends on multiple influences, including inflation expectations, real yields, central-bank activity, investment demand, geopolitical developments, and changes in the US dollar.
Investors should also distinguish the market price of gold from the total cost of owning physical bullion, which can include purchase premiums, storage costs, insurance, and differences between buying and selling prices.
For a broader explanation of the relationship between precious metals and long-term purchasing-power risk, see our guide to gold and inflation protection.
What Can Investors Learn From the November 10 Selloff?
Three observations are especially relevant.
- Expectations matter: A lower monthly inflation reading than the previous month can still unsettle markets if it exceeds forecasts.
- Interest-rate expectations matter: Higher anticipated policy rates can weigh on gold even during periods of elevated inflation.
- Market reactions can change: The partial rebound reported on November 11 illustrates why one session should not be treated as a definitive long-term trend.
These observations are useful for interpreting financial news. They are not trading signals or personalized investment recommendations.
What About Gold IRA Investors?
Investors considering physical precious metals within a retirement account should evaluate their investment horizon, risk tolerance, diversification needs, liquidity, and account-related expenses.
A monthly inflation report may affect the quoted price of gold, but it does not change the basic requirements for selecting an appropriate custodian, understanding eligible metals, or reviewing storage and transaction costs.
For information about retirement-account structures and related considerations, readers can explore our Gold IRA guide.
What Economic Reports Should Gold Investors Watch Next?
The October CPI release followed the October employment report published on November 6. Together, these reports provided new evidence about the strength of the labor market and the persistence of price pressures.
The earlier jobs report showed stronger-than-expected employment growth and was accompanied by rising yields and a stronger dollar.
Readers interested in the employment side of the economic picture can review our separate October 2026 US jobs report and gold market analysis.
Upcoming inflation and employment releases may change expectations about the Federal Reserve’s next steps.
| Economic Release | Scheduled Date | Market Relevance |
|---|---|---|
| October 2026 PPI | November 13, 2026 | Measures producer-level price changes. |
| November 2026 Employment Report | December 4, 2026 | Provides updated labor-market information. |
| November 2026 CPI | December 10, 2026 | Provides the next monthly consumer inflation reading. |
These dates are based on the official Bureau of Labor Statistics 2026 release calendar. Scheduled dates may be revised by the issuing agency.
Investors should consider how these reports interact with each other rather than relying on any single economic announcement to predict gold prices.
Frequently Asked Questions About the October 2026 CPI Report
What was the October 2026 US CPI reading?
Headline CPI increased 0.4% month over month, while core CPI increased 0.3%. Both figures were higher than economists’ consensus forecasts.
Why did gold prices fall after the CPI report?
The above-forecast inflation figures strengthened expectations for tighter Federal Reserve monetary policy. Treasury yields and the US dollar rose, while gold declined during the November 10 session.
How much did gold fall on November 10, 2026?
Reuters reported that spot gold declined 2.7% to $4,028.39 per ounce at 1:53 p.m. Eastern Time. December US gold futures settled 2.0% lower at $4,030.20 per ounce.
Why was the annual October 2026 inflation rate unavailable?
BLS did not collect October 2025 survey data because of a lapse in appropriations. Without the corresponding comparison indexes, it could not publish standard twelve-month changes for many CPI series, including the main headline and core measures.
Does higher inflation always push gold prices higher?
No. Higher inflation can increase interest in gold as a potential store of value, but the related rise in interest-rate expectations, bond yields, or the dollar can put short-term pressure on gold prices.
Will the Federal Reserve raise rates in December 2026?
Financial markets increased their expectations for a December rate hike following the October inflation report. However, those expectations do not constitute a confirmed policy decision. The Federal Reserve will consider additional information before its meeting.
Final Thoughts: Why October Inflation Matters for Gold
The October 2026 CPI report showed that US consumer prices rose faster than economists had expected. Headline CPI increased 0.4% and core CPI rose 0.3% on a monthly basis.
The release was followed by rising Treasury yields, a stronger dollar, and a substantial decline in gold prices on November 10. A partial recovery reported the following day showed that market reactions can evolve as traders reassess economic information.
The central lesson is that the relationship between inflation and gold is influenced by monetary-policy expectations, interest rates, the dollar, and broader economic conditions.
For investors evaluating precious metals over longer periods, individual economic releases should form part of a broader assessment rather than serve as a standalone basis for buying or selling.
Explore Precious Metals With Opulent Gold Group
Understanding inflation and interest-rate developments can help investors evaluate market conditions. Long-term precious metals decisions also require careful consideration of diversification, risks, liquidity, transaction costs, and individual financial objectives.
Editorial Note:
This article was prepared on November 11, 2026, following the official October CPI release on November 10. Inflation data are sourced from the US Bureau of Labor Statistics. Gold, currency, and Treasury market observations are attributed to Reuters reports published November 10 and November 11. Market prices are historical snapshots and should not be interpreted as live quotations.
Financial Disclaimer:
This material is provided for general educational and informational purposes only. It does not constitute personalized financial, investment, legal, or tax advice. Precious metals involve market volatility, transaction costs, and the possibility of financial loss. Past performance does not guarantee future results.